Showing posts with label research sites. Show all posts

Tuesday, May 23, 2017

REMOTE Redux: DTP trials are still hard

Maybe those pesky sites are good for something after all. 

It's been six years since Pfizer boldly announced the launch of its "clinical trial in a box". The REMOTE trial was designed to be entirely online, and involved no research sites: study information and consent was delivered via the web, and medications and diaries were shipped directly to patients' homes.

Despite the initial fanfare, within a month REMOTE's registration on ClinicalTrials.gov was quietly reduced from 600 to 283. The smaller trial ended not with a bang but a whimper, having randomized only 18 patients in over a year of recruiting.

Still, the allure of direct to patient clinical trials remains strong, due to a confluence of two factors. First, a frenzy of interest in running "patient centric clinical trials". Sponsors are scrambling to show they are doing something – anything – to show they have shifted to a patient-centered mindset. We cannot seem to agree what this means (as a great illustration of this, a recent article in Forbes on "How Patients Are Changing Clinical Trials" contained no specific examples of actual trials that had been changed by patients), but running a trial that directly engages patients wherever they are seems like it could work.

The less-openly-discussed other factor leading to interest in these DIY trials is sponsors' continuing willingness to heap almost all of the blame for slow-moving studies onto their research sites. If it’s all the sites’ fault – the reasoning goes – then cutting them out of the process should result in trials that are both faster and cheaper. (There are reasons to be skeptical about this, as I have discussed in the past, but the desire to drop all those pesky sites is palpable.)

However, while a few proof-of-concept studies have been done, there really doesn't seem to have been another trial to attempt a full-blown direct-to-patient clinical trial. Other pilots have been more successful, but had fairly lightweight protocols. For all its problems, REMOTE was a seriously ambitious project that attempted to package a full-blown interventional clinical trial, not an observational study.

In this context, it's great to see published results of the TAPIR Trial in vasculitis, which as far as I can tell is the first real attempt to run a DIY trial of a similar magnitude to REMOTE.

TAPIR was actually two parallel trials, identical in every respect except for their sites: one trial used a traditional group of 8 sites, while the other was virtual and recruited patients from anywhere in the country. So this was a real-time, head-to-head assessment of site performance.

And the results after a full two years of active enrollment?
  • Traditional sites: 49 enrolled
  • Patient centric: 10 enrolled
Even though we’re six years later, and online/mobile communications are even more ubiquitous, we still see the exact same struggle to enroll patients.

Maybe it’s time to stop blaming the sites? To be fair, they didn’t exactly set the world on fire – and I’m guessing the total cost of activating the 8 sites significantly exceeded the costs of setting up the virtual recruitment and patient logistics. But still, the site-less, “patient centric” approach once again came up astonishingly short.


ResearchBlogging.org Krischer J, Cronholm PF, Burroughs C, McAlear CA, Borchin R, Easley E, Davis T, Kullman J, Carette S, Khalidi N, Koening C, Langford CA, Monach P, Moreland L, Pagnoux C, Specks U, Sreih AG, Ytterberg S, Merkel PA, & Vasculitis Clinical Research Consortium. (2017). Experience With Direct-to-Patient Recruitment for Enrollment Into a Clinical Trial in a Rare Disease: A Web-Based Study. Journal of medical Internet research, 19 (2) PMID: 28246067

Wednesday, February 27, 2013

It's Not Them, It's You

Are competing trials slowing yours down? Probably not.

If they don't like your trial, EVERYTHING ELSE IN
THE WORLD is competition for their attention.
Rahlyn Gossen has a provocative new blog post up on her website entitled "The Patient Recruitment Secret". In it, she makes a strong case for considering site commitment to a trial – in the form of their investment of time, effort, and interest – to be the single largest driver of patient enrollment.

The reasoning behind this idea is clear and quite persuasive:
Every clinical trial that is not yours is a competing clinical trial. 
Clinical research sites have finite resources. And with research sites being asked to take on more and more duties, those resources are only getting more strained. Here’s what this reality means for patient enrollment. 
If research site staff are working on other clinical trials, they are not working on your clinical trial. Nor are they working on patient recruitment for your clinical trial. To excel at patient enrollment, you need to maximize the time and energy that sites spend recruiting patients for your clinical trial.
Much of this fits together very nicely with a point I raised in a post a few months ago, showing that improvements in site enrollment performance may often be made at the expense of other trials.

However, I would add a qualifier to these discussions: the number of active "competing" trials at a site is not a reliable predictor of enrollment performance. In other words, selecting sites who are not working on a lot of other trials will in no way improve enrollment in your trial.

This is an important point because, as Gossen points out, asking the number of other studies is a standard habit of sponsors and CROs on site feasibility questionnaires. In fact, many sponsors can get very hung up on competing trials – to the point of excluding potentially good sites that they feel are working on too many other things.

This came to a head recently when we were brought in to consult on a study experiencing significant enrollment difficulty. The sponsor was very concerned about competing trials at the sites – there was a belief that such competition was a big contributor to sluggish enrollment.

As part of our analysis, we collected updated information on competitive trials. Given the staggered nature of the trial's startup, we then calculated time-adjusted Net Patient Contributions for each site (for more information on that, see my write-up here).

We then cross-referenced competing trials to enrollment performance. The results were very surprising: the quantity of other trials had no effect on how the sites were doing.  Here's the data:

Each site's enrollment performance as it relates to number of other trials it's running.
Competitive trials do not appear to substantially impact rates of enrollment.
 Each site is a point. Good sites (higher up) and poor enrollers (lower) are virtually identical in terms of how many concurrent trials they were running.

Since running into this result, I've looked at the relationship between the number of competing trials in CRO feasibility questionnaires and final site enrollment for many of the trials we've worked on. In each case, the "competing" trials did not serve as even a weak predictor of eventual site performance.

I agree with Gossen's fundamental point that a site's interest and enthusiasm for your trial will help increase enrollment at that site. However, we need to do a better job of thinking about the best ways of measuring that interest to understand the magnitude of the effect that it truly has. And, even more importantly, we have to avoid reliance on substandard proxy measurements such as "number of competing trials", because those will steer us wrong in site selection. In fact, almost everything we tend to collect on feasibility questionnaires appears to be non-predictive and potentially misleading; but that's a post for another day.

[Image credit: research distractions courtesy of Flikr user ronocdh.]

Friday, January 25, 2013

Less than Jaw-Dropping: Half of Sites Are Below Average


Last week, the Tufts Center for the Study of Drug Development unleashed the latest in their occasional series of dire pronouncements about the state of pharmaceutical clinical trials.

One particular factoid from the CSDD "study" caught my attention:
Shocking performance stat:
57% of these racers won't medal!
* 11% of sites in a given trial typically fail to enroll a single patient, 37% under-enroll, 39% meet their enrollment targets, and 13% exceed their targets.
Many industry reporters uncritically recycled those numbers. Pharmalot noted:
Now, the bad news – 48 percent of the trial sites miss enrollment targets and study timelines often slip, causing extensions that are nearly double the original duration in order to meeting enrollment levels for all therapeutic areas.
(Fierce Biotech and Pharma Times also picked up the same themes and quotes from the Tufts PR.)

There are two serious problems with the data as reported.

One: no one – neither CSDD nor the journalists who loyally recycle its press releases – seem to remember this CSDD release from less than two years ago. It made the even-direr claim that
According to Tufts CSDD, two-thirds of investigative sites fail to meet the patient enrollment requirements for a given clinical trial.
If you believe both Tufts numbers, then it would appear that the number of under-performing sites has dropped almost 20% in just 20 months – from 67% in April 2011 to 48% in January 2013. For an industry as hidebound and slow-moving as drug development, this ought to be hailed as a startling and amazing improvement!

Maybe at the end of the day, 48% isn't a great number, but surely this would appear to indicate we're on the right track, right? Why would no one mention this?

Which leads me to problem two: I suspect that no one is connecting the 2 data points because no one is sure what it is we're even supposed to be measuring here.

In a clinical trial, a site's "enrollment target" is not an objectively-defined number. Different sponsors will have different ways of setting targets – in fact, the method for setting targets may vary from team to team within a single pharma company.

The simplest way to set a target is to divide the total number of expected patients by the number of sites. If you have 50 sites and want to enroll 500 patients, then viola ... everyone's got a "target" of 10 patients! But then as soon as some sites start exceeding their target, others will, by definition, fall short. That’s not necessarily a sign of underperformance – in fact, if a trial finishes enrollment dramatically ahead of schedule, there will almost certainly be a large number of "under target" sites.

Some sponsors and CROs get tricky about setting individual targets for each site. How do they set those? The short answer is: pretty arbitrarily. Targets are only partially based upon data from previous, similar (but not identical) trials, but are also shifted up or down by the (real or perceived) commercial urgency of the trial. They can also be influenced by a variety of subjective beliefs about the study protocol and an individual study manager's guesses about how the sites will perform.

If a trial ends with 0% of sites meeting their targets, the next trial in that indication will have a lower, more achievable target. The same will happen in the other direction: too-easy targets will be ratcheted up. The benchmark will jump around quite a bit over time.

As a result, "Percentage of trial sites meeting enrollment target" is, to put it bluntly, completely worthless as an aggregate performance metric. Not only will it change greatly based upon which set  of sponsors and studies you happen to look at, but even data from the same sponsors will wobble heavily over time.

Why does this matter?

There is a consensus that clinical development is much too slow -- we need to be striving to shorten clinical trial timelines and get drugs to market sooner. If we are going to make any headway in this effort, we need to accurately assess the forces that help or hinder the pace of development, and we absolutely must rigorously benchmark and test our work. The adoption of, and attention paid to unhelpful metrics will only confuse and delay our effort to improve the quality of speed of drug development.

[Photo of "underperforming" swimmers courtesy Boston Public Library on flikr.]

Tuesday, January 15, 2013

Holding Your Breath Also Might Work

Here's a fitting postscript to yesterday's article about wishful-thinking-based enrollment strategies: we received a note from a research site this morning. The site had opted out of my company's comprehensive recruitment campaign, telling the sponsor they preferred to recruit patients their own way.

Here's the latest update from the coordinator:
I've found one person and have called a couple of times, but no return calls.  I will be sending this potential patient a letter this week.  I'm keeping my fingers crossed in finding someone soon!
They don't want to participate in a broad internet/broadcast/advocacy group program, but it's OK -- they have their fingers crossed!

Thursday, December 20, 2012

All Your Site Are Belong To Us


'Competitive enrollment' is exactly that.

This is a graph I tend to show frequently to my clients – it shows the relative enrollment rates for two groups of sites in a clinical trial we'd been working on. The blue line is the aggregate rate of the 60-odd sites that attended our enrollment workshop, while the green line tracks enrollment for the 30 sites that did not attend the workshop. As a whole, the attendees were better enrollers that the non-attendees, but the performance of both groups was declining.

Happily, the workshop produced an immediate and dramatic increase in the enrollment rate of the sites who participated in it – they not only rebounded, but they began enrolling at a better rate than ever before. Those sites that chose not to attend the workshop became our control group, and showed no change in their performance.

The other day, I wrote about ENACCT's pilot program to improve enrollment. Five oncology research sites participated in an intensive, highly customized program to identify and address the issues that stood in the way of enrolling more patients.  The sites in general were highly enthused about the program, and felt it had a positive impact on the operations.

There was only one problem: enrollment didn't actually increase.

Here’s the data:

This raises an obvious question: how can we reconcile these disparate outcomes?

On the one hand, an intensive, multi-day, customized program showed no improvement in overall enrollment rates at the sites.

On the other, a one-day workshop with sixty sites (which addressed many of the same issues as the ENACCT pilot: communications, study awareness, site workflow, and patient relationships) resulted in and immediate and clear improvement in enrollment.

There are many possible answers to this question, but after a deeper dive into our own site data, I've become convinced that there is one primary driver at work: for all intents and purposes, site enrollment is a zero-sum game. Our workshop increased the accrual of patients into our study, but most of that increase came as a result of decreased enrollments in other studies at our sites.

Our workshop graph shows increased enrollment ... for one study. The ENACCT data is across all studies at each site. It stands to reason that if sites are already operating at or near their maximum capacity, then the only way to improve enrollment for your trial is to get the sites to care more about your trial than about other trials that they’re also participating in.

And that makes sense: many of the strategies and techniques that my team uses to increase enrollment are measurably effective, but there is no reason to believe that they result in permanent, structural changes to the sites we work with. We don’t redesign their internal processes; we simply work hard to make our sites like us and want to work with us, which results in higher enrollment. But only for our trials.

So the next time you see declining enrollment in one of your trials, your best bet is not that the patients have disappeared, but rather that your sites' attention has wandered elsewhere.


Tuesday, December 11, 2012

What (If Anything) Improves Site Enrollment Performance?

ENACCT has released its final report on the outcomes from the National Cancer Clinical Trials Pilot Breakthrough Collaborative (NCCTBC), a pilot program to systematically identify and implement better enrollment practices at five US clinical trial sites. Buried after the glowing testimonials and optimistic assessments is a grim bottom line: the pilot program didn't work.

Here are the monthly clinical trial accruals at each of the 5 sites. The dashed lines mark when the pilots were implemented:


4 of the 5 sites showed no discernible improvement. The one site that did show increasing enrollment appears to have been improving before any of the interventions kicked in.

This is a painful but important result for anyone involved in clinical research today, because the improvements put in place through the NCCTBC process were the product of an intensive, customized approach. Each site had 3 multi-day learning sessions to map out and test specific improvements to their internal communications and processes (a total of 52 hours of workshops). In addition, each site was provided tracking tools and assigned a coach to assist them with specific accrual issues.

That’s an extremely large investment of time and expertise for each site. If the results had been positive, it would have been difficult to project how NCCTBC could be scaled up to work at the thousands of research sites across the country. Unfortunately, we don’t even have that problem: the needle simple did not move.

While ENACCT plans a second round of pilot sites, I think we need to face a more sobering reality: we cannot squeeze more patients out of sites through training and process improvements. It is widely believed in the clinical research industry that sites are low-efficiency bottlenecks in the enrollment process. If we could just "fix" them, the thinking goes – streamline their workflow, improve their motivation – we could quickly improve the speed at which our trials complete. The data from the NCCTBC paints an entirely different picture, though. It shows us that even when we pour large amounts of time and effort into a tailored program of "evidence and practice-based changes", our enrollment ROI may be nonexistent.

I applaud the ENACCT team for this pilot, and especially for sharing the full monthly enrollment totals at each site. This data should cause clinical development teams everywhere to pause and reassess their beliefs about site enrollment performance and how to improve it.

Sunday, July 15, 2012

Site Enrollment Performance: A Better View

Pretty much everyone involved in patient recruitment for clinical trials seems to agree that "metrics" are, in some general sense, really really important. The state of the industry, however, is a bit dismal, with very little evidence of effort to communicate data clearly and effectively. Today I’ll focus on the Site Enrollment histogram, a tried-but-not-very-true standby in every trial.

Consider this graphic, showing enrolled patients at each site. It came through on a weekly "Site Newsletter" for a trial I was working on:


I chose this histogram not because it’s particularly bad, but because it’s supremely typical. Don’t get me wrong ... it’s really bad, but the important thing here is that it looks pretty much exactly like every site enrollment histogram in every study I’ve ever worked on.

This is a wasted opportunity. Whether we look at per-site enrollment with internal teams to develop enrollment support plans, or share this data with our sites to inform and motivate them, a good chart is one of the best tools we have. To illustrate this, let’s look at a few examples of better ways to look at the data.

If you really must do a static site histogram, make it as clear and meaningful as possible. 

This chart improves on the standard histogram in a few important ways:


Stateful histo - click to enlarge

  1.  It looks better. This is not a minor point when part of our work is to engage sites and makes them feel like they are part of something important. Actually, this graph is made clearer and more appealing mostly by the removal of useless attributes (extraneous whitespace, background colors, and unhelpful labels).
  2. It adds patient disposition information. Many graphs – like the one at the beginning of this post – are vague about who is being counted. Does "enrolled" include patients currently being screened, or just those randomized? Interpretations will vary from reader to reader. Instead, this chart makes patient status an explicit variable, without adding to the complexity of the presentation. It also provides a bit of information about recent performance, by showing patients who have been consented but not yet fully screened.
  3. It ranks sites by their total contribution to the study, not by the letters in the investigator’s name. And that is one of the main reasons we like to share this information with our sites in the first place.
Find Opportunities for Alternate Visualizations
 
There are many other ways in which essentially the same data can be re-sliced or restructured to underscore particular trends or messages. Here are two that I look at frequently, and often find worth sharing.

Then versus Now

Tornado chart - click to enlarge

This tornado chart is an excellent way of showing site-level enrollment trajectory, with each sites prior (left) and subsequent (right) contributions separated out. This example spotlights activity over the past month, but for slower trials a larger timescale may be more appropriate. Also, how the data is sorted can be critical in the communication: this could have been ranked by total enrollment, but instead sorts first on most-recent screening, clearly showing who’s picked up, who’s dropped off, and who’s remained constant (both good and bad).

This is especially useful when looking at a major event (e.g., pre/post protocol amendment), or where enrollment is expected to have natural fluctuations (e.g., in seasonal conditions).

Net Patient Contribution

In many trials, site activation occurs in a more or less "rolling" fashion, with many sites not starting until later in the enrollment period. This makes simple enrollment histograms downright misleading, as they fail to differentiate sites by the length of time they’ve actually been able to enroll. Reporting enrollment rates (patients per site per month) is one straightforward way of compensating for this, but it has the unfortunate effect of showing extreme (and, most importantly, non-predictive), variance for sites that have not been enrolling for very long.

As a result, I prefer to measure each site in terms of its net contribution to enrollment, compared to what it was expected to do over the time it was open:
Net pt contribution - click to enlarge

To clarify this, consider an example: A study expects sites to screen 1 patient per month. Both Site A and Site B have failed to screen a single patient so far, but Site A has been active for 6 months, whereas Site B has only been active 1 month.

On an enrollment histogram, both sites would show up as tied at 0. However, Site A’s 0 is a lot more problematic – and predictive of future performance – than Site B’s 0. If I compare them to benchmark, then I show how many total screenings each site is below the study’s expectation: Site A is at -6, and Site B is only -1, a much clearer representation of current performance.

This graphic has the added advantage of showing how the study as a whole is doing. Comparing the total volume of positive to negative bars gives the viewer an immediate visceral sense of whether the study is above or below expectations.

The above are just 3 examples – there is a lot more that can be done with this data. What is most important is that we first stop and think about what we’re trying to communicate, and then design clear, informative, and attractive graphics to help us do that.

Wednesday, June 20, 2012

Faster Trials are Better Trials

[Note: this post is an excerpt from a longer presentation I made at the DIA Clinical Data Quality Summit, April 24, 2012, entitled Delight the Sites: The Effect of Site/Sponsor Relationships on Site Performance.]

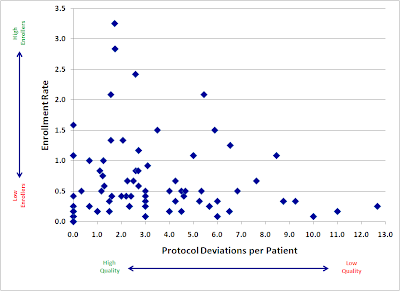
When considering clinical data collected from sites, what is the relationship between these two factors?
  • Quantity: the number of patients enrolled by the site
  • Quality: the rate of data issues per enrolled patient
When I pose this question to study managers and CRAs, I usually hear that they believe there is an inverse relationship at work. Specifically, most will tell me that high-enrolling sites run a great risk of getting "sloppy" with their data, and that they will sometimes need to caution sites to slow down in order to better focus on accurate data collection and reporting.

Obviously, this has serious implications for those of us in the business of accelerating clinical trials. If getting studies done faster comes at the expense of clinical data quality, then the value of the entire enterprise is called into question. As regulatory authorities take an increasingly skeptical attitude towards missing, inconsistent, and inaccurate data, we must strive to make data collection better, and absolutely cannot afford to risk making it worse.

As a result, we've started to look closely at a variety of data quality metrics to understand how they relate to the pace of patient recruitment. The results, while still preliminary, are encouraging.

Here is a plot of a large, recently-completed trial. Each point represents an individual research site, mapped by both speed (enrollment rate) and quality (protocol deviations). If faster enrolling caused data quality problems, we would expect to see a cluster of sites in the upper right quadrant (lots of patients, lots of deviations).

Click to enlarge: Enrollment and Quality


Instead, we see almost the opposite. Our sites with the fastest accrual produced, in general, higher quality data. Slow sites had a large variance, with not much relation to quality: some did well, but some of the worst offenders were among the slowest enrollers.

There are probably a number of reasons for this trend. I believe the two major factors at work here are:
  1. Focus. Having more patients in a particular study gives sites a powerful incentive to focus more time and effort into the conduct of that study.
  2. Practice. We get better at most things through practice and repetition. Enrolling more patients may help our site staff develop a much greater mastery of the study protocol.
The bottom line is very promising: accelerating your trial’s enrollment may have the added benefit of improving the overall quality of your data.

We will continue to explore the relationship between enrollment and various quality metrics, and I hope to be able to share more soon.

Tuesday, June 19, 2012

Pfizer Shocker: Patient Recruitment is Hard

In what appears to be, oddly enough, an exclusive announcement to Pharmalot, Pfizer will be discontinuing its much-discussed “Trial in a box”—a clinical study run entirely from a patient’s home. Study drug and other supplies would be shipped directly to each patient, with consent, communication, and data collection happening entirely via the internet.

The trial piloted a number of innovations, including some novel and intriguing Patient Reported Outcome (PRO) tools.  Unfortunately, most of these will likely not have been given the benefit of a full test, as the trial was killed due to low patient enrollment.

The fact that a trial designed to enroll less than 300 patients couldn’t meet its enrollment goal is sobering enough, but in this case the pain is even greater due to the fact that the study was not limited to site databases and/or catchment areas.  In theory, anyone with overactive bladder in the entire United States was a potential participant. 

And yet, it didn’t work.  In a previous interview with Pharmalot, Pfizer’s Craig Lipset mentions a number of recruitment channels – he specifically cites Facebook, Google, Patients Like Me, and Inspire, along with other unspecified “online outreach” – that drove “thousands” of impressions and “many” registrations, but these did not amount to, apparently, even close to the required number of consented patients. 

Two major questions come to mind:

1.    How were patients “converted” into the study?  One of the more challenging aspects of patient recruitment is often getting research sites engaged in the process.  Many – perhaps most – patients are understandably on the fence about being in a trial, and the investigator and study coordinator play the single most critical role in helping each patient make their decision. You cannot simply replace their skill and experience with a website (or “multi-media informed consent module”). 

2.    Did they understand the patient funnel?  I am puzzled by the mention of “thousands of hits” to the website.  That may seem like a lot, if you’re not used to engaging patients online, but it’s actually not necessarily so. 
Jakob Nielsen's famous "Lurker Funnel"
seems worth mentioning here...
Despite some of the claims made by patient communities, it is perfectly reasonable to expect that less than 1% of visitors (even somewhat pre-qualified visitors) will end up consenting into the study.  If you’re going to rely on the internet as your sole means of recruitment, you should plan on needing closer to 100,000 visitors (and, critically: negotiate your spending accordingly). 

In the prior interview, Lipset says:
I think some of the staunch advocates for using online and social media for recruitment are still reticent to claim silver bullet status and not use conventional channels in parallel. Even the most aggressive and bullish social media advocates, generally, still acknowledge you’re going to do this in addition to, and not instead of more conventional channels.

This makes Pfizer’s exclusive reliance on these channels all the more puzzling.  If no one is advocating disintermediating the sites and using only social media, then why was this the strategy?

I am confident that someone will try again with this type of trial in the near future.  Hopefully, the Pfizer experience will spur them to invest in building a more rigorous recruitment strategy before they start.

[Update 6/20: Lipset weighed in via the comments section of the Pharmalot article above to clarify that other DTP aspects of the trial were tested and "worked VERY well".  I am not sure how to evaluate that clarification, given the fact that those aspects couldn't have been tested on a very large number of patients, but it is encouraging to hear that more positive experiences may have come out of the study.]

Wednesday, January 4, 2012

Public Reporting of Patient Recruitment?

A few years back, I was working with a small biotech companies as they were ramping up to begin their first-ever pivotal trial. One of the team leads had just produced a timeline for enrollment in the trial, which was being circulated for feedback. Seeing as they had never conducted a trial of this size before, I was curious about how he had arrived at his estimate. My bigger clients had data from prior trials (both their own and their CRO’s) to use, but as far as I could tell, this client had absolutely nothing.

He proudly shared with me the secret of his methodology: he had looked up some comparable studies on ClinicalTrials.gov, counted the number of listed sites, and then compared that to the sample size and start/end dates to arrive at an enrollment rate for each study. He’d then used the average of all those rates to determine how long his study would take to complete.

If you’ve ever used ClinicalTrials.gov in your work, you can immediately determine the multiple, fatal flaws in that line of reasoning. The data simply doesn’t work like that. And to be fair, it wasn’t designed to work like that: the registry is intended to provide public access to what research is being done, not provide competitive intelligence on patient recruitment.

I’m therefore sympathetic, but skeptical, of a recent article in PLoS Medicine, Disclosure of Investigators' Recruitment Performance in Multicenter Clinical Trials: A Further Step for Research Transparency, that proposes to make reporting of enrollment a mandatory part of the trial registry. The authors would like to see not only actual randomized patients for each principal investigator, but also how that compares to their “recruitment target”.

The entire article is thought-provoking and worth a read. The authors’ main arguments in favor of mandatory recruitment reporting can be boiled down to:

  • Recruitment is many trials is poor, and public disclosure of recruitment performance will improve it
  • Sponsors, patient groups, and other stakeholders will be interested in the information
  • The data “could prompt queries” from other investigators

The first point is certainly the most compelling – improving enrollment in trials is at or near the top of everyone’s priority list – but the least supported by evidence. It is not clear to me that public scrutiny will lead to faster enrollment, and in fact in many cases it could quite conceivably lead to good investigators opting to not conduct a trial if they felt they risked being listed as “underperforming”. After all, there are many factors that will influence the total number of randomized patients at each site, and many of these are not under the PI’s control.

The other two points are true, in their way, but mandating that currently-proprietary information be given away to all competitors will certainly be resisted by industry. There are oceans of data that would be of interest to competitors, patient groups, and other investigators – that simply cannot be enough to justify mandating full public release.


Image: Philip Johnson's Glass House from Staib via Wikimedia Commons.

Friday, March 25, 2011

Mind the Gap

Modern clinical trials in the pharmaceutical industry are monuments of rigorous analysis. Trial designs are critically examined and debated extensively during the planning phase – we strain to locate possible sources of bias in advance, and adjust to minimize or compensate for them. We collect enormous quantities of efficacy and safety data using standardized, pre-validated techniques. Finally, a team of statisticians parses the data (adhering, of course, to an already-set-in-stone Statistical Analysis Plan to avoid the perils of post-hoc analysis) … then we turn both the data and the analysis over in their entirety to regulatory authorities, who in turn do all they can to verify that the results are accurate, correctly interpreted, and clinically relevant.

It is ironic, then, that our management of these trials is so casual and driven by personal opinions. We all like to talk a good game about metrics, but after the conversation we lapse back into our old, distinctly un-rigorous, habits. Example of this are everywhere once you start to look for them: one that just caught my eye is from a recent Center Watch article:

Survey: Large sites winning more trials than small

Are large sites—hospitals, academic medical centers—getting all the trials, while smaller sites continue to fight for the work that’s left over?

That’s what results of a recent survey by Clinical Research Site Training (CRST) seem to indicate. The nearly 20-year-old site-training firm surveyed 500 U.S. sites in December 2010, finding that 66% of large sites say they have won more trials in the last three years. Smaller sites weren’t asked specifically, but anecdotally many small and medium-sized sites reported fewer trials in recent years.
Let me repeat that last part again, with emphasis: “Smaller sites weren’t asked specifically, but anecdotally…

At this point, the conversation should stop. Nothing to see here, folks -- we don’t actually have evidence of anything, only a survey data point juxtaposed with someone’s personal impression -- move along.

So what are we to do then? I think there are two clear areas where we collectively need to improve:

1. Know what we don’t know. The sad and simple fact is that there are a lot of things we just don’t have good data on. We need to resist the urge to grasp at straws to fill those knowledge gaps – it leaves the false impression that we’ve learned something.

2. Learn from our own backyard. As I mentioned earlier, good analytic practices are pervasive on the executional side of trials. We need to think more rigorously about our data needs, earlier in the process.

The good news is that we have everything we need to make this a reality – we just need to have a bit of courage to admit the gap (or, occasionally, chasm) of our ignorance on a number of critical issues and develop a thoughtful plan forward.